The objective of this study was to identify and quantify odor sources throughout the production process of an oil refinery located in Rio Grande do Sul State, Brazil. The oil refinery process 32,000 m³ of crude oil per day to supply the regional market. The main produced products are diesel fuel, gasoline, gas, fuel oils, aviation fuel, solvents, asphalt, coke, sulfur and propene.
The NH3 (ammonia), H2S/CH4S (hydrogen sulphide/methylmercaptan), SO2 (sulfur dioxide) and VOCs (volatile organic compounds) gases were measured during 14 consecutive days, at 53 points inside the refinery. Measurements were performed in the following process areas: Hydrotreating (HDT), sulfur recovery unit (SRU), acidic water and waste tanks, oil-water separator, wastewater treatment.
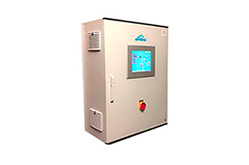
The measurements conducted at ground level were to estimate the fugitive odor emission. In these cases, the sensors were mounted 1.5 meters from the ground on a tripod (Figure 1). Additionally, measurements were made at the stacks (SRU and flares), over the wastewater treatment lagoon and at the breathing of the storage tanks. For this measurements a Drone DJI was used to suspend a set of integrated micro-sensors that analyze the air continuously. This system made it possible to record the emission from stacks at heights of up to 120 meters above ground level, which was previously impossible to accomplish. All measurements were carried out using ENVEA’s Cairsens sensors, which provide automatic and continuous recordings of gases concentration. All four sensors used in the field campaign are listed in Table 1.
Table 1: Electrochemical sensors
| Sensor | Range (ppb) |
| H2S/CH4S | 0 – 1,000 |
| NH3 | 0 – 25,000 |
| nmVOC | 0 – 16,000 |
| SO2 | 0 – 1,000 |

Figure 1: Ground measurement station and monitoring sensors.
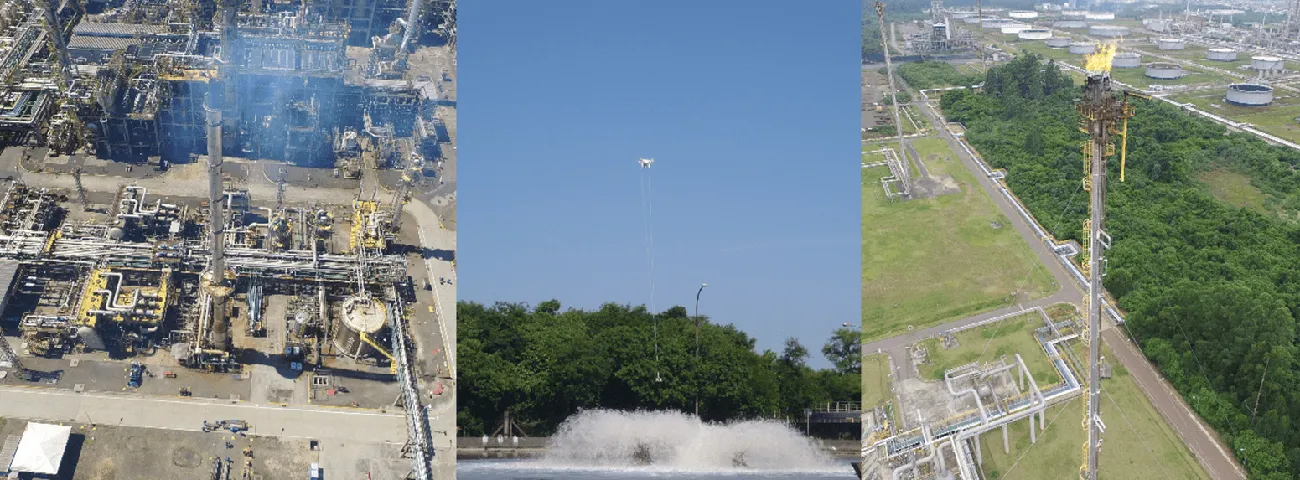
Figure 2: Unmanned air vehicle (quadricopter drone) used to take the monitoring sensors close to stack SRU, aerated lagoon and Flare.
The results of the monitored maximum values at ground of H2S/CH4S, NH3, COVs e SO2 were interpolated using a squared distance weighting average to obtain a better outlook and overlap the aerial image of the study area. Thus, the results presented next show the worst odor pollution condition. All NH3 measurements were below the odor perception limit of 1,580 ppb (Nagata, 2003).
The maximum values monitored of H2S/CH4S are located at wastewater treatment, where the highest concentrations were at the raw effluent (point 12) and at the float (point 13). The emission in this process is practically constant in an open area.
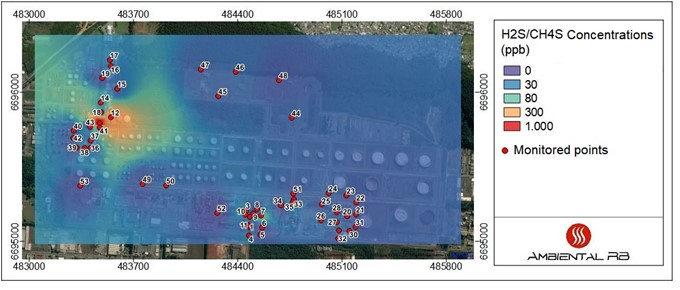
Figure 3: Map of H2S/CH4S concentration (in ppb). Red dots show the monitored spots.
The highest concentrations of VOCs were in the wastewater treatment, primarily at the raw effluent, float and around the lagoon. Near to the merox process (point 7) there was also a high concentration of VOCs with a noticeable odor. In addition, the oil-water separator (point 36 and 38) had a continuous emission of VOCs and a strong odor as well.
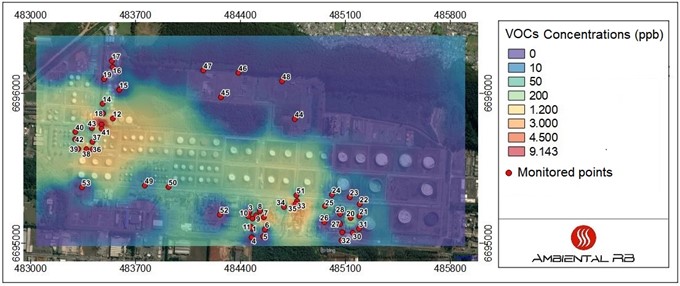
Figure 4: Map of VOCs concentration (in ppb). Red dots show the monitored spots.
The SO2 gas was present in all areas of the refinery uninterruptedly. However, only one monitored value was above the odor perception limit of 870 ppb (Nagata, 2003). Depending on weather conditions or atypical emission conditions, peaks with high concentration and short duration inside the plant may occur, like as the maximum value of 1,000 ppb identified in point 27, located in the SRU.
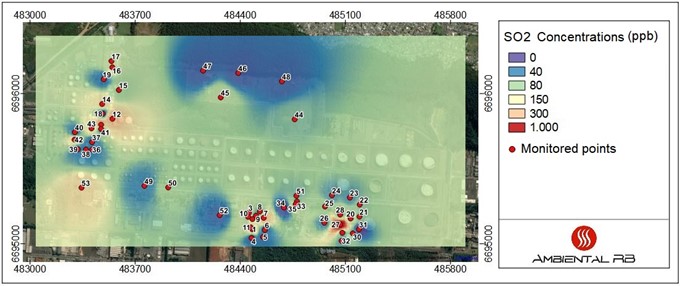
Figure 5: Map of SO2 concentration (in ppb). Red dots show the monitored spots.
The drone measurements carried out near the stacks showed that these sources are potential emitters of a substantial concentration of odorous gases. Nevertheless, the measurements on the flares (Figure 6) indicate a significant variation in the emissions, as some records present high concentrations of SO2 and low of H2S/CH4S, while the opposite situation was observed in another day. It was also evident the lower emissions in Flare 1 compared to Flares 2 and 3. For safety reasons, measurements were made close to the height of the flame, but approximately 70 meters distant from it. Even this far, significant concentrations of gases were detected, which may be higher at atypical moments in the process.

Figure 6: Measurements on Flares.
The measurements near the SRU stack (Figure 7) show the highest concentrations of SO2 and H2S/CH4S emitted by this process. The maximum value recorded for both gases was 1,000 ppb, the upper limit of the sensors. Even measuring at a distance of approximately 50 meters from the stack gas outlet, concentrations were high. As the odor perception threshold for H2S is low, within the range of 30 to 50 ppb in outdoor environments (Collins and Lewis, 2000), such intense emission can lead to bad odor events depending on weather conditions.
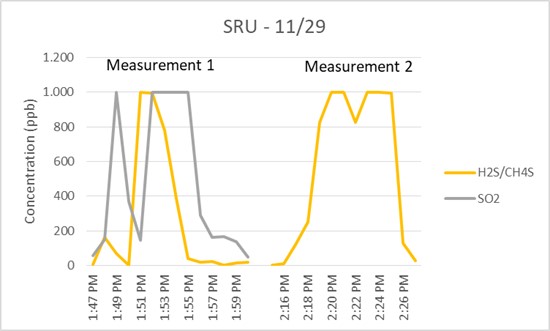
Figure 7: Measurements on SRU.
The results of odorous gases analysis showed that the largest sources of emissions are the industrial effluent treatment, the flare stack and the Sulfur Recovery Unit’s stack. However, the coverage radius for the effluent treatment station is small due to the emission characteristics, as the emissions at ground level come from the effluent dumping, the aerated lagoon and the float. The main sources of odor emission that can spread and annoy the neighborhood are the stacks as they presented the higher concentrations, henceforth their odor emission can be perceived from kilometers of distance.
REFERENCES
- Collins J., Lewis D., 2000, Hydrogen Sulfide: Evaluation of current California air quality standards with respect to protection of children, California Office of Environmental Health Hazard Assessment, 1 – 25.
- Nagata, Yoshio, 2003, Measurement of Odor Threshold by Triangle Odor Bag Method, Japan Ministry of the Environment, Tokyo.
Verwandte Inhalte
Informationsanfrage
